Hey everyone! This is part 2 of the monitoring series, which I will cover my basic Prometheus and Grafana installation.
So Prometheus is a monitoring tools that extracts various metrics from various services, including databases, clusters, and hardware. Grafana is a tool that takes these metrics, and converts them into graphs. You can think like Prometheus is backend and Grafana is the frontend.
In order to use these tools to their full extent, you need to know PromQL, which is the query language of Prometheus. I didn’t know anything about it until this project. I watched couple of videos and read the documentation. However in order to actually get great at it, it probably would take some dedication, which I found unnecessary for my situation, so I will basically use pre-made queries and graphs.
This is not advanced-level use-case whatsoever, I only used it for basic monitoring.
Prometheus Installation
I created a LXC container for it, and installed it via apt package manager.
sudo apt install prometheusThis installs:
- Service: prometheus.service
- Config: /etc/prometheus/prometheus.yml
- Data dir: /var/lib/prometheus
- Listens on: 9090
Then I enabled and checked status it via:
systemctl enable --now prometheus
systemctl status prometheus --no-pager
Logic of Prometheus
Prometheus works as a master-slave config. There is a master Prometheus server that takes the metrics, and clients that serves these metrics. We just installed the server with commands above. Now, for the clients (or the same machine if you will monitor that), we need to install the client.
Prometheus use a small tarball called “Node-Exporter” to showcase metrics. You just install and run it, then configure the master to take these metrics.
Install Node-Exporter
You can read the link below, but it basically downloads the tarball and runs it. But we will create a service so the exporter can start automatically. Also, we will create a user for this for increased security.
https://prometheus.io/docs/guides/node-exporter/#tarball-installation
wget https://github.com/prometheus/prometheus/releases/download/v*/prometheus-*.*-amd64.tar.gz
tar xvf prometheus-*.*-amd64.tar.gz

mv node_exporter* /usr/local/bin/
useradd --no-create-home --shell /usr/sbin/nologin nodeusr
This downloaded, extracted, and moved the executable. We also created a user. After this, let’s create the service:
nano /etc/systemd/system/node_exporter.service
Type:
[Unit]
Description=Prometheus Node Exporter
After=network.target

[Service]
User=nodeusr
ExecStart=/usr/local/bin/node_exporter
Restart=always

[Install]
WantedBy=default.target
The node-exporter is installed! It runs on port 9100, so you can go to http://localhost:9100 to check it manually.
Now, it is time to configure the Prometheus server
Server Configuration
In the future, I will share my note base in my website and link useful information there, like the config file options. But now, I will just put them here.
Config File Options
1. global
Applies to all jobs unless overridden:
global:   scrape_interval: 15s       # How often Prometheus pulls metrics   evaluation_interval: 15s   # How often rules/alerts are checked
scrape_timeout: 10s        # How long to wait before a scrape is considered failed external_labels:
    monitor: 'example'     # Extra label(s) added to every metric
Key setting: scrape_interval — shorter means fresher data but more load.
2. alerting
Tells Prometheus where your Alertmanager is:
alerting:
  alertmanagers:
  - static_configs:
    - targets: ['localhost:9093']
If you’re not using Alertmanager, you can remove or ignore this section.
3. rule_files
Lists files that contain recording rules or alerting rules:
rule_files:
  - "first_rules.yml"
Rules are YAML files that define conditions and create new metrics or alerts.
4. scrape_configs
Defines what targets Prometheus scrapes:
scrape_configs:
  - job_name: 'prometheus'
    scrape_interval: 5s       # Overrides global for this job
    scrape_timeout: 5s
    static_configs:
      - targets: ['localhost:9090']
Important keys:
job_name→ Logical label grouping (appears asjob=in metrics)targets→ List ofhost:portwhere metrics livemetrics_path(default/metrics) → Path to scrapescheme(defaulthttp) → Change tohttpsif needed
You can add more jobs for other exporters, e.g.:
  - job_name: 'proxmox-node'
    static_configs:
      - targets: ['192.168.1.10:9100']
The “prometheus” job is only for showing the scrape performance, target health etc, not CPU and RAM. You need to install node_exporter and use port 9100 for that.
How to define your own config
- Set global settings for scrape/evaluation intervals.
- List each target (exporter) under
scrape_configswith ajob_name. - (Optional) Override intervals per job if you want more or less frequent scrapes.
- (Optional) Add rules via
rule_files. - If using Alertmanager, add it under
alerting.
Example Config
If you read the above, you will have an idea about how to configure. We basically have the global options which you leave at default. Alerting and rules are for AlertManager which I might talk about later. We only need the scrape_configs part for now.
These are for scraping the metrics that node-exporters are sending. You can use this format as it is the most simple way:
scrape_configs:
  - job_name: 'whatever_you_want'
    static_configs:
      - targets: ['localhost/IP:9100']
After we added this, you might want to reload/restart the prometheus servicesudo systemctl reload|restart prometheus
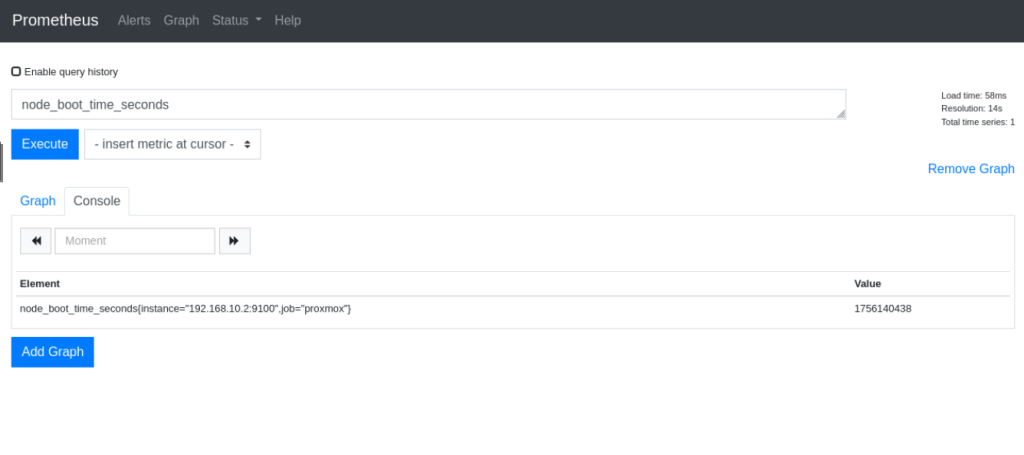
After this, you should be getting the metrics from your nodes. You can just go to your prometheus server and run the query node_boot_time_seconds to check if you get answers to your queries.

This is the Prometheus part. Now lets go to the Grafana
Grafana Installation
For Grafana installation, I basically followed the default instructions. You can take a look at them. I am just copying the commands here for easy access.
https://grafana.com/docs/grafana/latest/setup-grafana/installation/debian/
(This is for debian systems)
sudo apt-get install -y apt-transport-https software-properties-common wget
sudo mkdir -p /etc/apt/keyrings/
wget -q -O - https://apt.grafana.com/gpg.key | gpg --dearmor | sudo tee /etc/apt/keyrings/grafana.gpg > /dev/null
echo "deb [signed-by=/etc/apt/keyrings/grafana.gpg] https://apt.grafana.com stable main" | sudo tee -a /etc/apt/sources.list.d/grafana.list
echo "deb [signed-by=/etc/apt/keyrings/grafana.gpg] https://apt.grafana.com beta main" | sudo tee -a /etc/apt/sources.list.d/grafana.list
sudo apt-get update
sudo apt-get install grafana-enterprise
I went with the enterprise edition. You can go with OSS if you prefer, but I never tried.
Config files:/usr/share/grafana/conf/defaults.ini -> default settings/etc/grafana/grafana.ini -> main settings
Then I started and enabled the service:sudo systemctl enable --now grafana
It works on port 3000, so you can go to http://IP:3000 and see the dashboard.
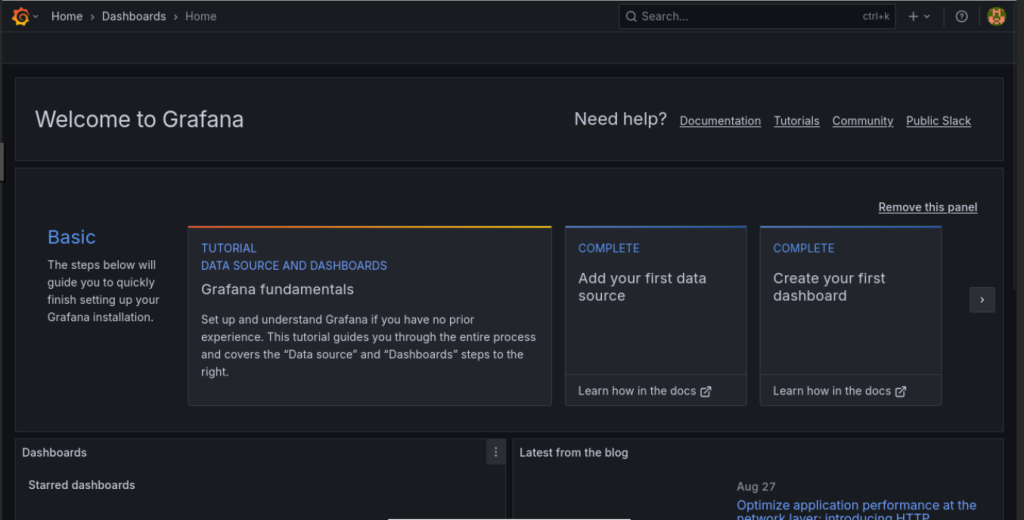
You will probably need to create an account, I forgot how I did, but after you login, you should see a screen like this:

Connect Prometheus
Grafana works like this: It takes the data from data sources, and shows them in a dashboard.
So first, lets add Prometheus.
You should go to Menu -> Connections -> Data sources and click “Add new data source”. Then add Prometheus and type the IP. You can save and test.
Create Dashboard
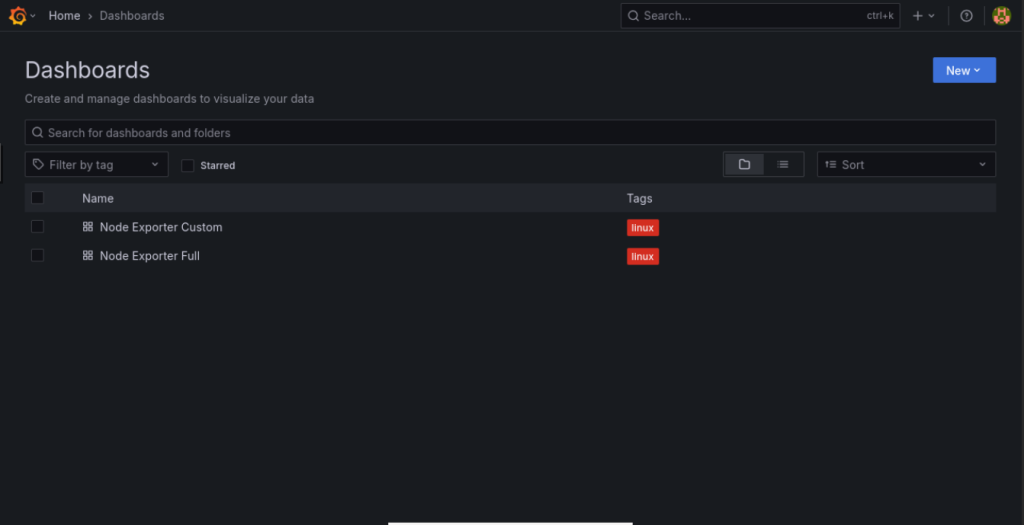
After we add the source, we need to have a dashboard. Go to Menu -> Dashboards. You will see you don’t have any dashboard.
- Creating a dashboard requires knowing PromQL, so we will just import a dashboard that shows nearly everything about our node. To monitor other instances like Kubernetes, you need to find another dashboard than I will suggest.
We will import the dashboard “Node Exporter Full”.
https://grafana.com/grafana/dashboards/1860-node-exporter-full/
You will go to New -> Import in the dashboards, and paste the link of the dashboard

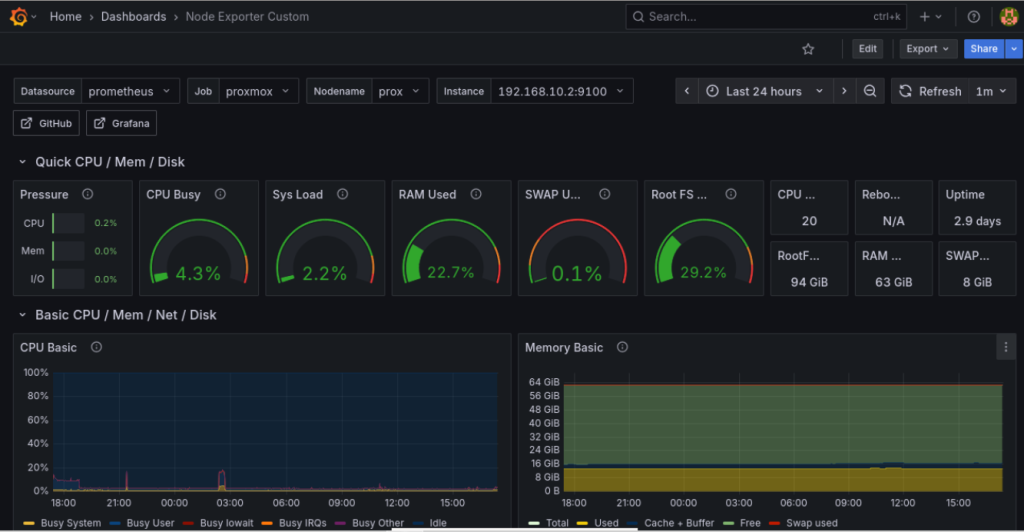
I imported twice. Left one at default, and modified the other one (removed graphs I don’t need).
My modified one looks like this:

It still shows more than enough even though my modifications. It is especially helpful since it shows information about my UPS and generic info about the VMs.
Conclusion
So basically this is how I installed Grafana and Prometheus. I also set the AlertManager of Prometheus, but since I don’t have any useful alarms nor I don’t know an actual use case for my situation, I didn’t include here.
I hope this blog helps.