Hey everyone, today I will be talking about my Monitoring Solution series’ first blog, which will include UptimeKuma and Netdata Cloud integration.
What are they?
UptimeKuma is a simple program that checks if a system/service is up or down. It is really easy to setup and use.
Netdata on the other hand is still an easy to setup program, but much more powerful. It is a monitoring tool that shows you your metrics, logs, system use, and in my case, virtual machine use. It also has a cloud solution (free tier includes up to 5 machine) so you can centralize your homelab in one place and access it everywhere.
UptimeKuma Installation
Even though it has a native method and I love manual installations, I went with Docker image since it is suggested and I wanted a low-effort solution. Since I didn’t have a Docker VM, I created one. It is a standard Debian machine with Docker engine installed.
I also installed Portainer in that VM, but didn’t look into it much. I might have a blog post about it later.
So I just went to the GitHub page, and copied the one-liner:
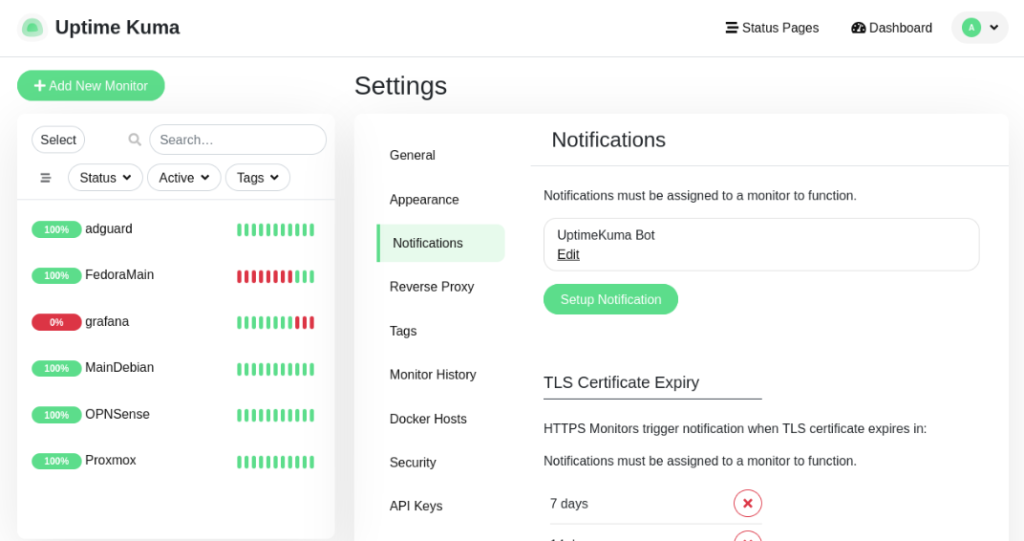
docker run -d --restart=always -p 3001:3001 -v uptime-kuma:/app/data --name uptime-kuma louislam/uptime-kuma:1The only customization I did was creating a Telegram bot for notifications.
I simply followed the instructions for creating a Telegram bot from the notifications section. I used the BotFather to create a bot.
So my setup looks like this:
Netdata Installation
My main purpose was monitoring my main Proxmox server. First I thought of creating a dedicated container, but since I wanted to monitor the whole hardware, I needed to install it on the Proxmox itself.
So I went to install the agent. However, if you install the agent standalone, it won’t be connecting to the cloud, which means you won’t be able to see and control multiple devices from single place. You wouldn’t need to check their individual dashboard.
So I went and created a Netdata cloud account with free tier. Then, I simply go to ‘Nodes -> Add Nodes’ and copied the code and pasted to my Proxmox terminal.

Conclusion
So that’s it! This was a short blog, since what I did was simple enough, but the value of monitoring tools is understood once you need them. So it is great to have them around. Plus, it is great to being able to see if and when your services/servers are done.